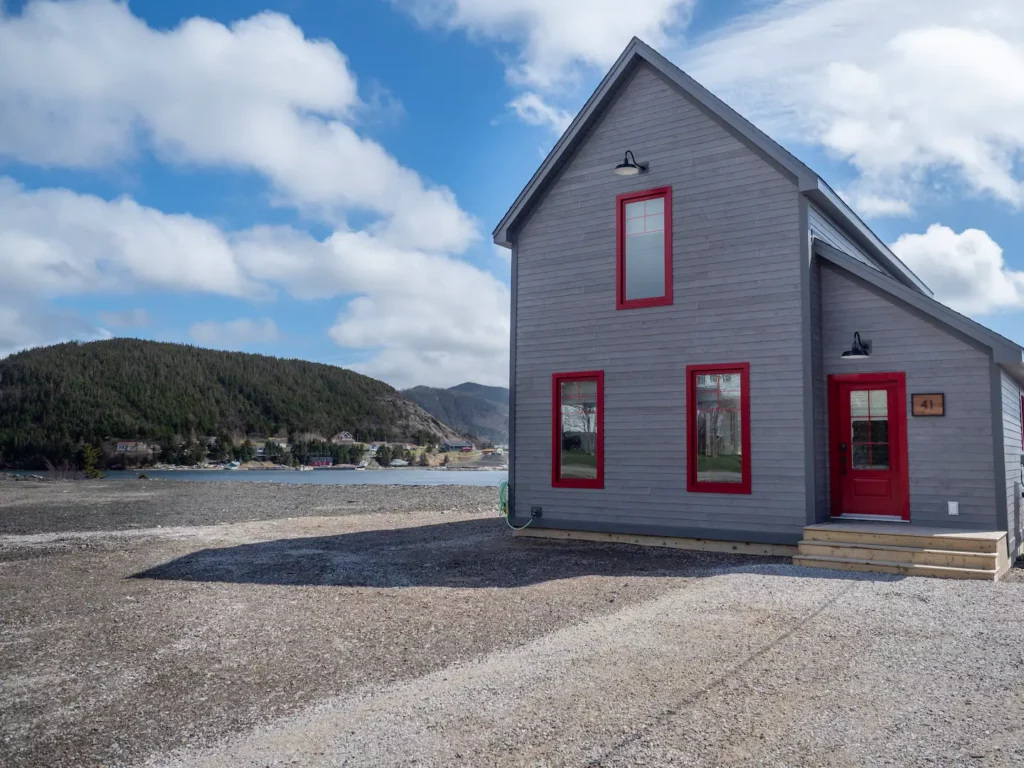
The truth behind hosting in Newfoundland & Labrador might surprise you.
While the province’s rugged coastlines and postcard-perfect towns make it a dream destination, the data tells a far more nuanced story. According to the latest AirROI 2025 Report, occupancy rates hover around 40%, median annual revenue sits near $20,000, and nearly 9 out of 10 guests are domestic travellers. For anyone running or considering a short-term rental here, these numbers aren’t just trivia..they’re the reality check that separates successful hosts from struggling ones.
Behind each statistic lies a powerful insight: the importance of seasonality, the rise of longer stays, and the shift toward local guests rather than international tourists. The top 10% of properties are still pulling in over $5,000 a month which proves there’s real opportunity for those who adapt.
In this article, we’ll break down ten key stats from the AirROI report and explore what they mean for hosts across Newfoundland and Labrador. Whether you manage a cozy cabin in Gros Morne or a Victorian home in downtown St. John’s, these numbers can help you rethink your strategy, boost bookings, and make data work in your favour.
10 Recent Newfoundland STR Hosting Facts
-
“What if your Airbnb only books 40 % of the time? Here’s the truth in Newfoundland & Labrador”
-
Hook the audience with: The average occupancy rate is 40.2% in NL.
-
Why it resonates: Many hosts assume higher occupancy — this headline surprises and prompts curiosity.
-
Use case: Share behind-the-scenes of how you manage your own 40% (or higher) to maximize revenue; show what works & what doesn’t.
-
-
“Median Airbnb in NL pulls just ~$20K per year — can you beat the odds?”
-
Data point: Median annual revenue is ~$20,294.
-
Why it works: The “$20K” number is tangible and invites the question: “How do I do better?”
-
Use case: Create a post comparing your listing’s performance vs. median; share a tip to move from median to top-tier.
-
-
“Peak month = August. Lowest = October. Here’s how the seasonality game plays out in NL”
-
Insight: Peak revenue month is August; low is October.
-
Why viral: People love “seasonality” content — it immediately says “plan accordingly”.
-
Use case: Post a mini-guide: “How I change my pricing, minimum stay, and promos from August → October”.
-
-
“35% of NL listings are set for 30+ nights minimum — monthly stays are now a major strategy”
-
Data point: 35.3% of listings have minimum stay of 30+ nights.
-
Why it stands out: It flips the common “short-stay” mindset; highlights the rising importance of extended-stay market.
-
Use case: Share your own case study: “Here’s how I switched to targeting 30-night stays and what changed”.
-
-
“Domestic travellers make up 85% in NL — why you should speak to locals, not just tourists”
-
Data point: Guests from domestic markets = ~85%.
-
Why it hits: Most hosts think “international tourists” as their main target — this hooks by revealing the opposite.
-
Use case: A post on how you tailor your décor, language, amenities (fast WiFi, smart features) for the “local” or domestic traveler (e.g., from St. John’s) rather than overseas guests.
-
-
“Only ~42% occupancy in Newfoundland & Labrador — here’s how I flip that for my Victorian home”
-
Data point: Average occupancy roughly 41.9%.
-
Use case: A behind-the-scenes reel showing how you turn a slow month into a booked month using décor, deals, or local experience packages.
-
-
“Median annual revenue around ~$19,634 — can my Victorian B&B beat the average?”
-
Data: Median annual revenue for NL region ~ US$19,634.
-
Use case: A “challenge” post on Instagram: “Our target for this year — exceed the local median & here’s the plan.”
-
-
“Top 10% of listings pull $5,050+ in a peak month — what they’re doing differently in NL”
-
Data: Best-in-class properties in NL can achieve monthly revenues of $5,050+.
-
Use case: Create a listicle or carousel: “5 things those hosts do that you might not yet”.
-
-
“30 + night minimum stay used by ~34% of listings — the shifted strategy for Newfoundland hosts”
-
Data: 34.3% of listings in NL have minimum stay requirement of 30+ nights.
-
Use case: A blog post or IG caption: “How we’re adapting to the trend of longer stays for 2025”.
-
-
“88% of guests are domestic travellers — ditch the globe-trotting angle, speak to locals instead”
-
Data: Domestic travellers ~87.8% of guests in NL.
-
Use case: A marketing video directed at Newfoundlanders / Canadians: “You don’t need to fly overseas — here’s your luxe local stay”
-
Hosting in Newfoundland and Labrador isn’t about chasing viral listings or relying on summer crowds — it’s about understanding the rhythms of this place and adapting to them.
The data paints a clear picture: opportunity exists for those who play the long game, cater to domestic travellers, and embrace seasonality rather than fear it.
Whether you’re running a historic Victorian home in St. John’s or a modern cabin by the coast, knowing these numbers can help you turn insights into income — and make your listing stand out in one of Canada’s most unique markets.
Sources
-
Airbnb Public Data, Canada Region Overview (2025)
-
Newfoundland & Labrador Tourism: Visitor Insights and Domestic Travel Trends (2024)
-
Statistics Canada: Tourism and Accommodation Reports (2024–2025)
